The Network Knows
“It is your data center. Do you know what’s happening inside it? Is it even possible to know? You need to know what’s going on, but how can you? You can’t map it, you can’t monitor everything. All these pieces are talking to each other and interaction in ways you don’t even know. Not knowing is risky. Adding a new security policy might just break everything…. What if you had complete visibility into everything in real time.”

The network plays a critical role inside a data center infrastructure. All data flows over the network between application tiers. The network connects everything, it sees everything, and … “it doesn’t lie”. If the network sees a packet, it is there, its real and it is sent by something. You can’t hide on the network (unlike root-kits installed on servers that are able to hide themselves from being detected).
Today (June 15th) Cisco announced Tetration Analytics. A platform to give customers full visibility in all communication flows inside their data center networks. Not only in real-time, but also historic communications. Think of Tetration Analytics as a time machine for the data center.
You can find more information at www.cisco.com/go/tetration
And if you have 2 minutes, there is a really great video.
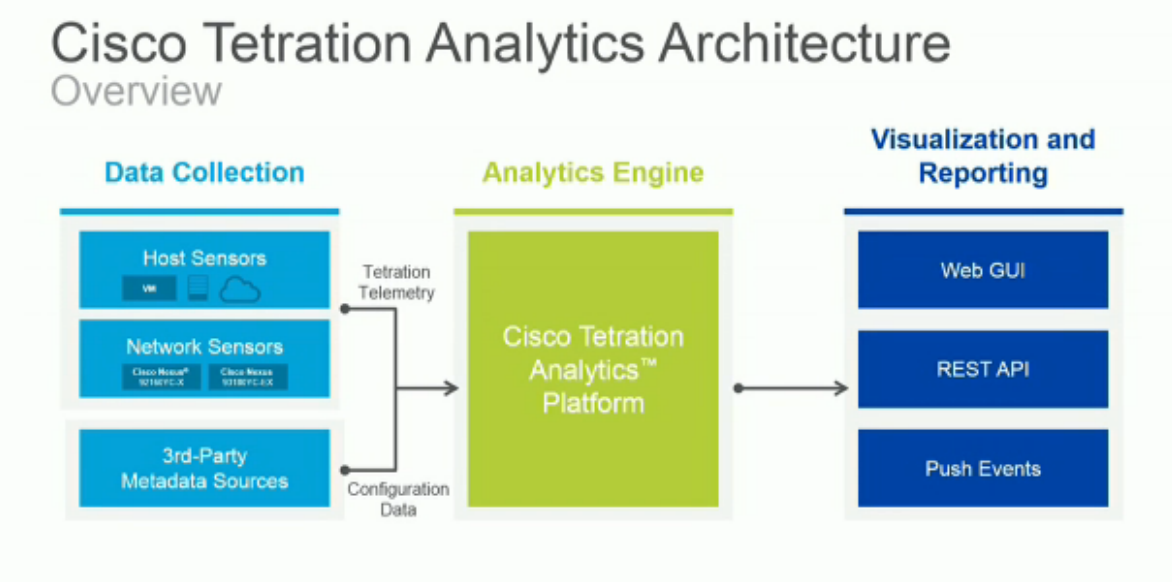
There are three parts to Tetration I’d like to talk about. The sensors that do the data collection, the Tetration Analytics engine itself, and the visualisation & reporting that delivers Actionable Insights.

The sensors:
Any analytics can only be as good as the data it has to run analytics against. There are two ways you could approach this. Select something already available, or build new. The engineering team behind Tetration took the approach that they knew exactly which problems they wanted to solve with the analytics. From that they knew what data they needed to have. And there was no sensor in the market that even came close to providing that level of data/details. So they decided to simply build a new better sensors then anything that is out there today.
There are two types of sensors in the solution, software and hardware sensors. The software sensors are agents that are installed in the guest operating system (either on bare-metal servers or inside VM’s). These software sensors come with an SLA that guarantees the maximum CPU performance they will use (which can be a concern systems admins have). The software sensors add an additional layer of data, besides providing detailed per packet and per flow meta data. They know which process-ID sent the packet, and which user initiated the process.
The hardware sensors are an amazing piece of work, they are part of the newest generation of Cisco CloudScale ASIC’s that power the Nexus 9000 family of switches. These sensors do not add any latency to the traffic going through the switch, while they do capture every single packet, from every single flow and collect meta-data from that, at full literate performance (remember, the new switches can run at 36 ports of 100Gbps). That’s beyond impressive. You cannot get line-rate telemetry data on every packet in every flow in a 1RU Top of Rack switch form factor. This is an industry first. This is innovation in silicon, and customers get to enjoy the value of that.
But how do you get that data off the ASIC and transported into the Tetration Analytics platform? You can’t expect to use the switch CPU to take that amount of telemetry data and frame it into an IP packet to then send it to the Tetration Analytics platform. The switch CPU would simply “die” from that much traffic. The engineers build into the ASIC the ability to create a new IP packet and send it directly from the ASIC to the Tetration Analytics platform, without using a single CPU cycle. Everything stays offloaded into the ASIC. Very cool, very scalable, very impressive. And it’s built into the new CloudScale Nexus 9000 switches.
You do not need both the software and hardware sensors deployed. You could start with only software sensors. It doesn’t even have to be a Cisco network, these software sensors can be deployed in workloads running on 100% non Cisco compute and networking components. If you happen to have workloads where you are unable to use software sensors (like non x86 workloads, or storage arrays or purpose built appliances), you can add a hardware sensor. Also the combination of having software and hardware sensors adds an extra level of visibility. But that is something for a later blog.
The Tetration Analytics platform:
This is a purpose build appliance, meant to scale so it can capture all flows and store them for a long time. Part of the appliance is big-data, but unlike any other big-data solution, you need not worry about setting up and maintaining a big-data system. Everything is automatic, you do not have access to the internals of the system. It is delivered as an appliance and it really operates that way. A lot of engineering work has gone into making the system behave like an appliance (and for anyone that has done work with any big-data solution, you know what that means).
The platform performs different tasks. It needs to ingest all the feeds that the sensors are sending it (the base unit scales to ingest over one million flows per second), it needs to process this data at that ingestion speed, and then store it. Then there are the processes that are run against the data to deliver actionable outcomes. The entire software is highly tuned to deliver real-time actionable outcome.
For now, I’ll leave it at that, partly because the way it is delivered means you do not need to know anything about the internals. We have been blind when it comes to what is happening inside our data centers. In one customer meeting the comment was made “this turns the lights on, so we can actually see what’s happening”. This of course in relation to the term Lights-Off DC Operations that many customers have moved to. We are giving full visibility into all these black boxes inside your data center.

Actionable Insights
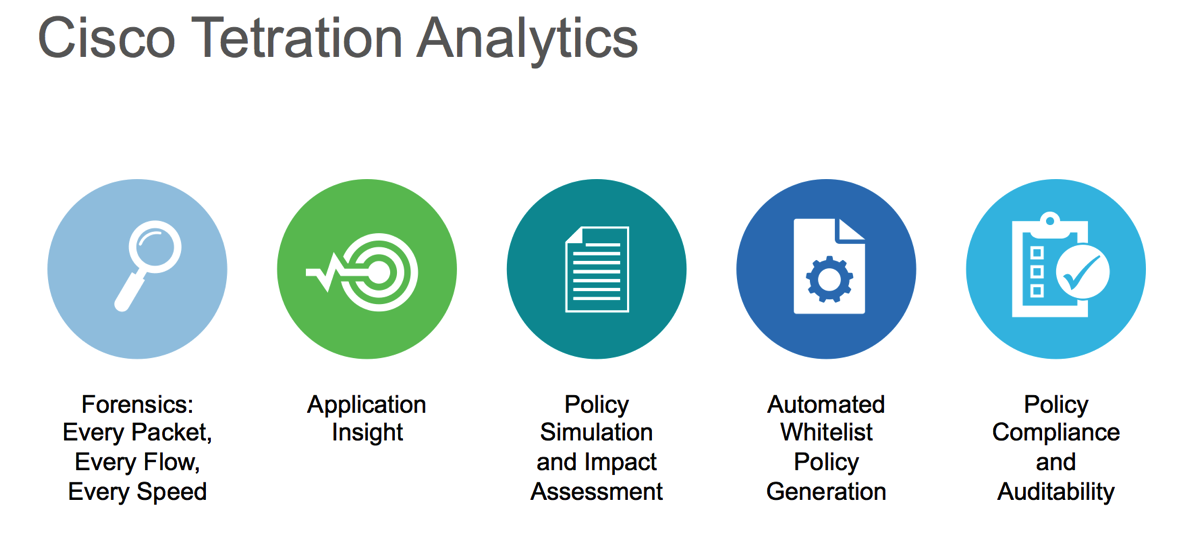
There are a number of use-cases that are built into the platform, available via a WEB GUI. There is also an API interface, and a subscription bus should external solutions wish to subscribe to real-time events. It is built to be an open platform.

These are just the beginning. The Tetration Platform will deliver many more applications on top of it. But these are the use-cases that are available day 1. These use-cases will individually be covered in later sessions.
In summary:
I’ve had the pleasure of working with the system for a while now. I’ve experienced first hand, via the dozens of briefings I’ve participated in, the customer reaction when they see what is now possible. It’s amazing.
THE NETWORK KNOWS.
You can find more information at www.cisco.com/go/tetration

1 comment
Colin Lynch
June 18, 2016 at 1:23 am (UTC 2) Link to this comment
Nice post TJ! Tetration looks an absolute revolutionary solution!
Great work Cisco!