Jun 15 2016

The Network Knows


The Network Knows
 
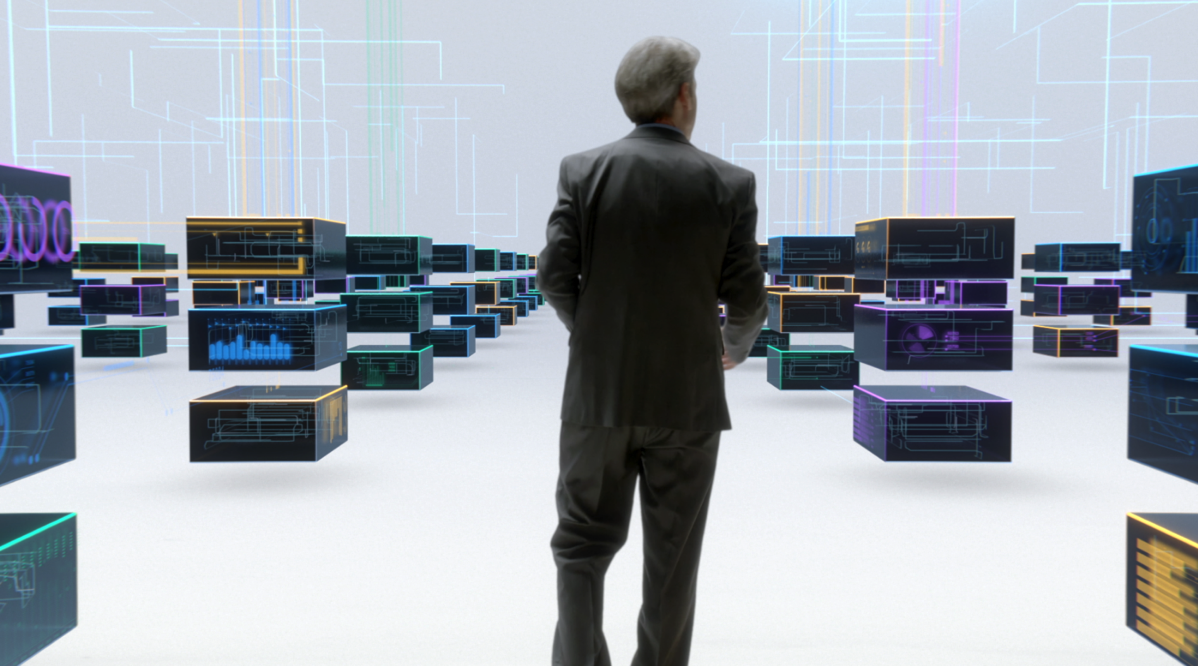
“It is your data center. Do you know what’s happening inside it? Is it even possible to know? You need to know what’s going on, but how can you? You can’t map it, you can’t monitor everything. All these pieces are talking to each other and interaction in ways you don’t even know. Not knowing is risky. Adding a new security policy might just break everything….  What if you had complete visibility into everything in real time.”


Tetration Your DC


The network plays a critical role inside a data center infrastructure. All data flows over the network between application tiers. The network connects everything, it sees everything, and … “it doesn’t lie”. If the network sees a packet, it is there, its real and it is sent by something. You can’t hide on the network (unlike root-kits installed on servers that are able to hide themselves from being detected).
 
Today (June 15th) Cisco announced Tetration Analytics. A platform to give customers full visibility in all communication flows inside their data center networks. Not only in real-time, but also historic communications. Think of Tetration Analytics as a time machine for the data center.  
 
You can find more information at www.cisco.com/go/tetration
And if you have 2 minutes, there is a really great video.
  
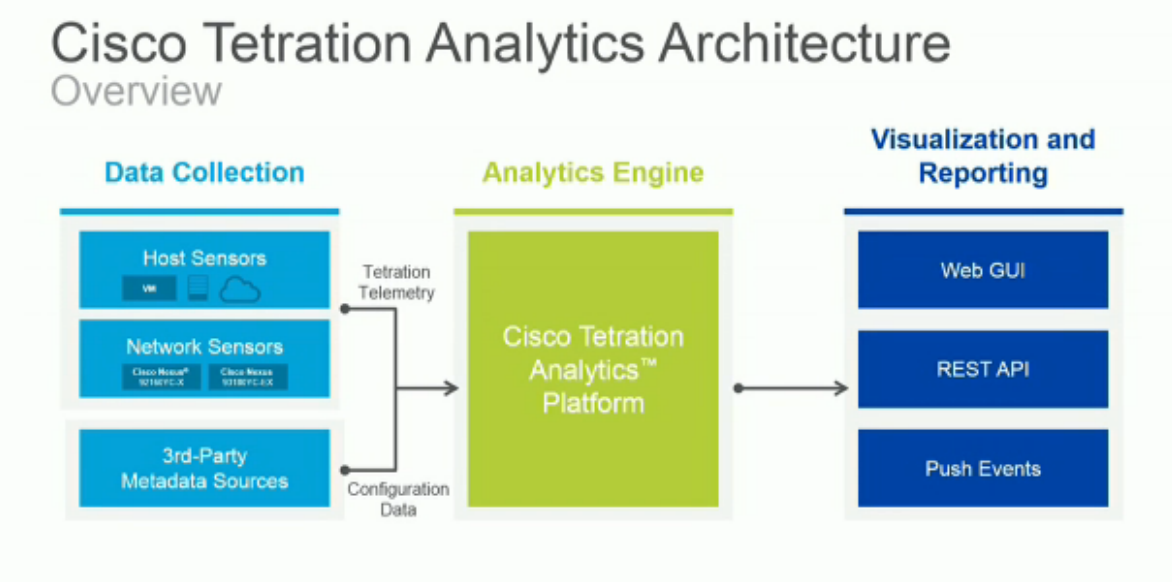
There are three parts to Tetration I’d like to talk about. The sensors that do the data collection, the Tetration Analytics engine itself, and the visualisation & reporting that delivers Actionable Insights.
 
Tetration Architecture

The sensors:
 
Any analytics can only be as good as the data it has to run analytics against. There are two ways you could approach this. Select something already available, or build new. The engineering team behind Tetration took the approach that they knew exactly which problems they wanted to solve with the analytics. From that they knew what data they needed to have. And there was no sensor in the market that even came close to providing that level of data/details. So they decided to simply build a new better sensors then anything that is out there today. 
 
There are two types of sensors in the solution, software and hardware sensors. The software sensors are agents that are installed in the guest operating system (either on bare-metal servers or inside VM’s). These software sensors come with an SLA that guarantees the maximum CPU performance they will use (which can be a concern systems admins have). The software sensors add an additional layer of data, besides providing detailed per packet and per flow meta data. They know which process-ID sent the packet, and which user initiated the process. 
 
The hardware sensors are an amazing piece of work, they are part of the newest generation of Cisco CloudScale ASIC’s that power the Nexus 9000 family of switches. These sensors do not add any latency to the traffic going through the switch, while they do capture every single packet, from every single flow and collect meta-data from that, at full literate performance (remember, the new switches can run at 36 ports of 100Gbps). That’s beyond impressive. You cannot get line-rate telemetry data on every packet in every flow in a 1RU Top of Rack switch form factor. This is an industry first. This is innovation in silicon, and customers get to enjoy the value of that. 
 
But how do you get that data off the ASIC and transported into the Tetration Analytics platform? You can’t expect to use the switch CPU to take that amount of telemetry data and frame it into an IP packet to then send it to the Tetration Analytics platform. The switch CPU would simply “die” from that much traffic. The engineers build into the ASIC the ability to create a new IP packet and send it directly from the ASIC to the Tetration Analytics platform, without using a single CPU cycle. Everything stays offloaded into the ASIC. Very cool, very scalable, very impressive. And it’s built into the new CloudScale Nexus 9000 switches. 
 
You do not need both the software and hardware sensors deployed. You could start with only software sensors. It doesn’t even have to be a Cisco network, these software sensors can be deployed in workloads running on 100% non Cisco compute and networking components. If you happen to have workloads where you are unable to use software sensors (like non x86 workloads, or storage arrays or purpose built appliances), you can add a hardware sensor. Also the combination of having software and hardware sensors adds an extra level of visibility. But that is something for a later blog. 
 
 
The Tetration Analytics platform:
 
This is a purpose build appliance, meant to scale so it can capture all flows and store them for a long time. Part of the appliance is big-data, but unlike any other big-data solution, you need not worry about setting up and maintaining a big-data system. Everything is automatic, you do not have access to the internals of the system. It is delivered as an appliance and it really operates that way. A lot of engineering work has gone into making the system behave like an appliance (and for anyone that has done work with any big-data solution, you know what that means). 
 
The platform performs different tasks. It needs to ingest all the feeds that the sensors are sending it (the base unit scales to ingest over one million flows per second), it needs to process this data at that ingestion speed, and then store it. Then there are the processes that are run against the data to deliver actionable outcomes. The entire software is highly tuned to deliver real-time actionable outcome.
 
For now, I’ll leave it at that, partly because the way it is delivered means you do not need to know anything about the internals. We have been blind when it comes to what is happening inside our data centers. In one customer meeting the comment was made “this turns the lights on, so we can actually see what’s happening”. This of course in relation to the term Lights-Off DC Operations that many customers have moved to. We are giving full visibility into all these black boxes inside your data center. 


Tetration visibility


Actionable Insights
 
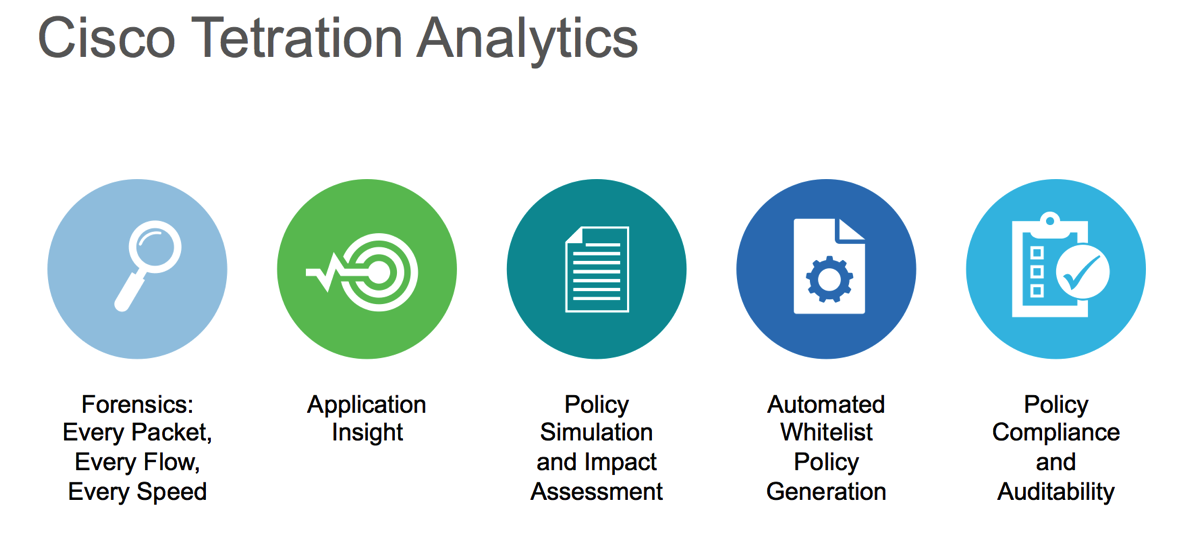
There are a number of use-cases that are built into the platform, available via a WEB GUI. There is also an API interface, and a subscription bus should external solutions wish to subscribe to real-time events. It is built to be an open platform.
 
Tetration UseCases
 
These are just the beginning. The Tetration Platform will deliver many more applications on top of it. But these are the use-cases that are available day 1. These use-cases will individually be covered in later sessions. 
 
 
In summary:
 
I’ve had the pleasure of working with the system for a while now. I’ve experienced first hand, via the dozens of briefings I’ve participated in, the customer reaction when they see what is now possible. It’s amazing.
 
THE NETWORK KNOWS. 


You can find more information at www.cisco.com/go/tetration
 

Oct 09 2014

Amsterdam Demonstration Lab (Cisco / Panduit)

Lets go down a layer in the data center. All the way down to the physical layer, perhaps even the facility foundation some might say. As infrastructure folks we always talk about things like networking, compute, virtualisation, storage, and more and more about applications. But those don’t work very well without a good environment for them to do their job. And that is what this blog is about. Describing how we changed our Amsterdam demonstration lab to a true data-center demonstration facility. 
 
I need to set the scene a bit in order for you to fully appreciate the massive change in our Amsterdam demonstration lab (if you want to skip and go straight to the result, scroll down to “The end result…”).
 
The current lab was built in 2002 and is located in the customer meetingroom area of the Cisco Amsterdam office. With a floor to ceiling glass wall, customers have unobstructed view into this space. The lab has been home to many different technologies we sell at Cisco. Each demo is owned by pre-sales System Engineer who looks after his demo in addition to his day job. The original layout of the lab was to put a lot of standard ‘lab racks’ into that space to house all the demonstrations.
 
After 11 years the result was a bit of a chaos. Many demonstrations had moved to a ‘cloud’ and no longer required physical lab space. But many old demo environments were never torn down and cleaned out. The data center pre-sales team had taken over the most prominent spot in the lab, right behind the glass viewing wall. This allowed customers to see all of the nice Nexus switches and UCS servers. Many of the demonstrations from other teams were running on these UCS servers and across these Nexus switches. 
 
A number of challenges had risen that let me to rethink what we could be doing with the lab:
  • The racks we were using were old, and not deep enough to properly hold the current generation of DC equipment. It is very frustrating to try and fit new cool ‘things’ into too small racks where you knew it would never look good.
  • Cable management was ‘cheap’ in the 2002 lab racks, and it looked that way
  • We didn’t have enough fiber going between racks, resulting in fibers being strung between racks, very visible 
  • Because demo’s changed over time and moved to virtual, we had lots of unused racks taking up space. And empty racks don’t look good in a demo environment.

Over time the primary group using the demonstration facility had become the data center team, but the room itself did not look like a data center. It looked like an old lab. You could show customers the latest Cisco DC hardware and give relevant demostrations… but in no way did the lab itself resemble what a data center would look like.

 
Cisco works with a number of specialized companies in the space of Data Center facilities (racks, cabling systems, power, cooling). One of those is Panduit. In 2013 I was invited to spend some time at Panduit’s new demonstration facility in Brussels (Belgium). It was everything I was missing in our Amsterdam lab to make it look like a DC, to make people stop, take notice, ask questions and basically say ‘wow’. 
 
I don’t know about your budgets for demonstration labs, but ours is very limited, it comes out of the general country budget and the little that is allocated to the lab is usually used to purchase new Cisco hardware (yes, we do have to pay for our own hardware, although we get a nice discount, and we get our own software for free).
 
The big question became, how do I ask Panduit to donate a 3 or 4 new racks to hold our DC demonstrations… Over the next few months that initial ask and conversation grew bigger and bigger and bigger. Panduit Netherlands did not have any demo facility, they were taking customers to Belgium. What if we could kill two birds with one stone:
  • Use the Cisco Amsterdam customer demo lab as a Panduit Netherlands demo lab
With that as the foundation for the business case the we went on a mission to convince the folks managing the budget that this was good for both companies. It might be pretty obvious to you where the Panduit investment would be used for, but you might wonder what Cisco investment would be required if Panduit takes care of all of the new racks and everything that goes with it. Well it turns out there is still a lot of other things that neef to happen that cost money:
  • This plan went significantly furter then just replacing a few racks in our lab, it was nearly a complete change.
  • Removal and disposal of old racks (which included old UPS batteries) and under the floor cabling
  • Removal and disposal of lots of older Cisco equipment
  • Changes to the lab power provisioning ensuring the new racks get proper and correct power to them
  • We were changing from under floor cabling to overhead cabling rails which required drilling into the ceiling to mount rails
  • Because we were changing to a much smaller number of racks we needed to change the floor tile layout, so partial new raised floor tiles.

All of the above costs money, money that Cisco of course would need to pay. But none of this was planned (or as the money people say “budgeted for”). And the amount was well above what we would normally spend on the lab. We managed to convince the Technical Director Cisco Netherlands that this was an investement worth making (and of course not making other investments that others find important – the money people like the term “zero sum game”).

 
By now what had started as an idea I had, had turned into a project that was being run by one of the new DC SE’s in the team (of course next to his day job) together with a Panduit engineer. All credits for the end result go to Bart Jan Menkveld (Cisco SE) and Sander Kaempfer, Rob Sanders and Ivo Vissers (Panduit employees) who did all of the actual hard work. 
 
It still took many many months before the full plan was in place and all budgets were approved. I won’t bore you with the details of all the things that have to happen to make it a reality. I am very happy to say that as of September 2014, we have a fantastic Data Center demonstration lab in the Cisco Amsterdam office.
 
 
The end result of what we now have, including a description of what customers can now see and experience.
 
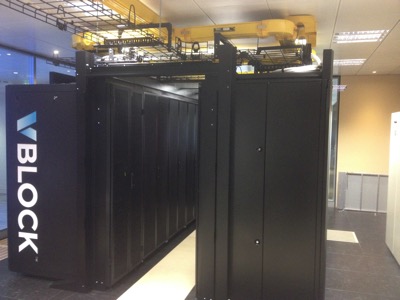
The demonstration setup is based on the “Panduit – Universal Aisle Containment” solution. We have two rows of “Panduit – Cabinet Solutions” with a mix of server and networking racks setup in a cold/hot aisle demonstration way with a door and roof. We also have a third row of these Panduit racks which contain all of our demonstration equipment that is connected to the Cisco DMZ (which needed to be physically separated from the internal lab racks due to policy). This gives us the ability to demonstrate the Aisle Containment as well as standalone racks. 
We are using a mixture of server and networking racks as that is what is aso needed in the real world. Some networking racks, and lots of server racks. The networking racks are optimised for all of the additional (patch) cabling. 


Ams ccc 1

  
All of the cabling between the racks is now running overhead using the “Panduit – Routing and Pathway Solutions” with separation of the copper and fibers runs, which is visually very appealing, but more importantly it is much easier to deal with then under the floor routing of cables that we had. We are using both the “Panduit – QuickNet Copper Cabling System” and the “Panduit – Signature Core Fiber for Cisco 40G BiDi Solution” throughout all the racks, and we are running 10G and 40G across it. And we are ready for 100G that will soon be arriving. 
 
All of the PDU’s are managed, where every single outlet can be switched on/off and monitored. That part of the demonstration we still have to complete so I can’t show you any output yet from the software that controls and monitors that (potential future blog posting). 
 
And finally there are what I call the “lots of little things that really matter”. I compare them to options in a car. You don’t necessarily think of them when you make your primary decision for the brand of car, but once you have gotten used to certain options in a car you would not want to own another car without some of the options. With Panduit I am talking about the options to nicely route cables inside a cabinet, all of the different air-duct options you have in case you need to deal with “strange” air-cooling, or all of the mounting brackets. Everything is there to simply make it practical and look professional and simply a joy to work with. 
 
What Cisco demonstrations do we have in Amsterdam that is running in these Panduit racks
  • VCE Vblock, an official one, direct from the VCe factory, very cool!!
  • FlexPod for VMware, 
  • FlexPod for Microsoft
  • RedHat KVM / OpenStack UCS environment
  • Standalone UCS Fabric, UCS Mini and UCS Rack servers.
  • Nexus 7010, 7004, 5500, 2000 series switches
  • Nexus 9508 and N9396 switches
  • ACI fabric running on N9396/N9336PQ switches
  • FabricPath fabric
  • Whole range of software to demonstrate 
So lots to see in the Cisco Amsterdam office from a facility (Panduit) perspective and Cisco demonstrations.


Jul 15 2014

Protected: The baby UCS

This content is password protected. To view it please enter your password below:

Jan 02 2013

Adding a UCS Rack Server

“When are you going to create a new video?”

That is a question I quite regularly receive from people that use the original “Adding a new UCS chassis” video. For a while now the idea was to show how you could add a UCS C-series (rack server) to a running UCS system. The challenge had been that it wasn’t actually very easy to run a UCS C-series server as part of a UCS system. It required manual configuration settings per C-series server.

Fast-forward to December 2012.

UCSM release 2.1 (in combination with the new adapter, the VIC-1225, and new firmware on the C-series servers) now makes adding a C-series server to a running UCS system actually easier then adding a new chassis and blades. What changed to make that possible?

  • The C-series server now come factory default with CIMC firmware that will “AUTO DETECT” if it the server is connected to be part of a running UCS system or if it is being used in a standalone mode. This removes the manual step to configure every server prior to connecting it to UCS
  • The VIC1225 adapter provides hardware support for Single Wire Management. Meaning the adapter has the capability to run the CIMC traffic over the same physical interfaces as the data traffic. This removes the need for a pair of 1Gb Management cables per server.
  • UCS Manager 2.1 software ties it all together.

That means that it now is real easy to add a UCS C-series rack server to a running UCS system. Just before Christmas we decided it was time to create the new video to demonstrate how easy it really is.

The Amsterdam Lab setup has a pair of UCS 6248 Fabric Interconnects that are supporting 2 chassis with blades. Also connected are two Nexus 2232PP Fabric Extenders allowing us to connect rack-servers to UCSM. One rack-server is already connected, although not through the new “Single Wire Management” capability.
If you are familiar with UCS, then you know that any running system has pools, policies and templates, and our lab system is no different. We have ESXi Service Profiles created that are associated against blades and we had created one that we told to look for a new UCS rack-server and when found, associate and boot.


Note: To change video resolution to HD, hit play and then you can change it to HD using the “Change Quality” button at the bottom right of the video screen. Sorry – right now this doesn’t work automatically.

What the video recording demonstrates is with zero configuration on the rack-server, it was attached to a running UCS system, without the need to configure anything on the rack server (no IP addresses, not BIOS version/settings, no boot locations). As you would expect from a UCS system, all of the server specific intelligence is handled through Service Profiles. And once the new rack-server is discovered by UCS Manager, any service profile can be associated with the rack-server.

References and recognition:

  • Sal Collora created a video that shows you how to setup the UCS Manager for supporting C-series rack servers.
  • @SordidOps – suggested the music (Daft Punk) for this video.

Enjoy

Older posts «